This web page was produced as an assignment for Genetics 564, an undergraduate course at UW-Madison
Microarrays
|
DNA microarrays measure gene expression in different cells, as cells specialize and may differ in which genes are active and which are inactive [1]. This technology allows scientists to investigate these patterns of expression in thousands of genes at the same time if they so choose. Researchers collect the mRNAs from cells, convert them to complimentary DNA (cDNA), and tag them with different fluorescent dyes. The labeled cDNAs are placed in microscopic wells on a microarray slide and scanned. Each fluorescent dye has a different intensity and lights the wells up in corresponding colors. The more active the gene is, the brighter fluorescence, while a less active gene will exhibit a dimmer fluorescence [1]. Microarray technology is instrumental for studying human disease. For example, microarray data can be used to classify cancers based on their gene expression patterns, as well as to develop therapies based off of these findings [1].
|
|
Gene Expression Omnibus (GEO)
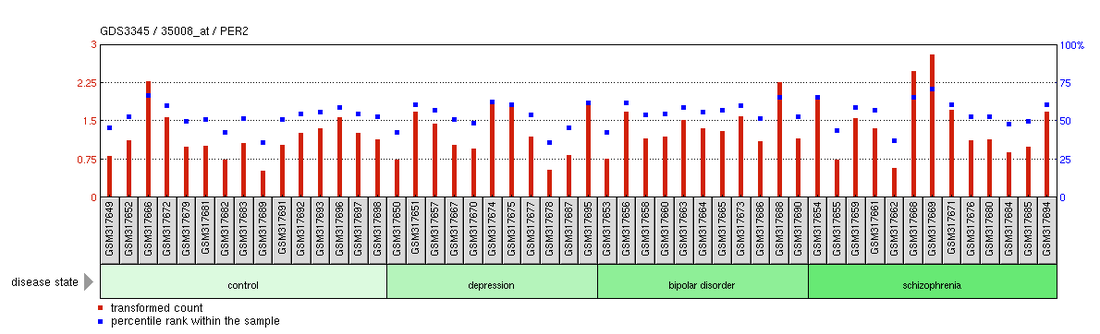
The Gene Expression Omnibus, or GEO, is an online database that stores microarray, next-generation sequencing, and other functional genomics data. Curators of the website collect samples submitted by researchers and create a datasets of "biologically and statistically" comparable GEO samples [2]. Profiles are derived from data sets and visually exhibit individual gene expression measurements [2]. A search of "PER2" in the GEO database turned up two profiles, including one that is related to the study of PER2 and depression (below).
Analysis
The above GEO profile measures PER2 protein expression in postmortem human brains with various mental illnesses. The green boxes along the bottom of the image represent the disease states of the sampled brains, while the gray vertical boxes represent individual samples among each state. Among each state, there are varying levels of PER2 expression among individuals. The depression group does not exhibit much difference from the control group. It is hard to say whether this data is significant and if we can develop any conclusions from it. As this is the only study in GEO measuring PER2 expression in depressed individuals, we have nothing to compare this data to. It will be necessary to conduct more expression analyses of PER2 before more definitive conclusions can be developed. Fortunately, GEO is constantly being updated with new research, so maybe someday additional PER2 profiles will be added that will contribute to the study of the genetic basis of depression.
References
[1] National Human Genome Research Institute. DNA Microarray Technology. http://www.genome.gov/10000533
[2] NCBI. GEO Overview. http://www.ncbi.nlm.nih.gov/geo/info/overview.html
[1] National Human Genome Research Institute. DNA Microarray Technology. http://www.genome.gov/10000533
[2] NCBI. GEO Overview. http://www.ncbi.nlm.nih.gov/geo/info/overview.html
